> ## Documentation Index
> Fetch the complete documentation index at: https://docs.qtap.qa/llms.txt
> Use this file to discover all available pages before exploring further.
# Analytics Overview
> What data is available in the Analytics section and how to use the time period selector and export tools.
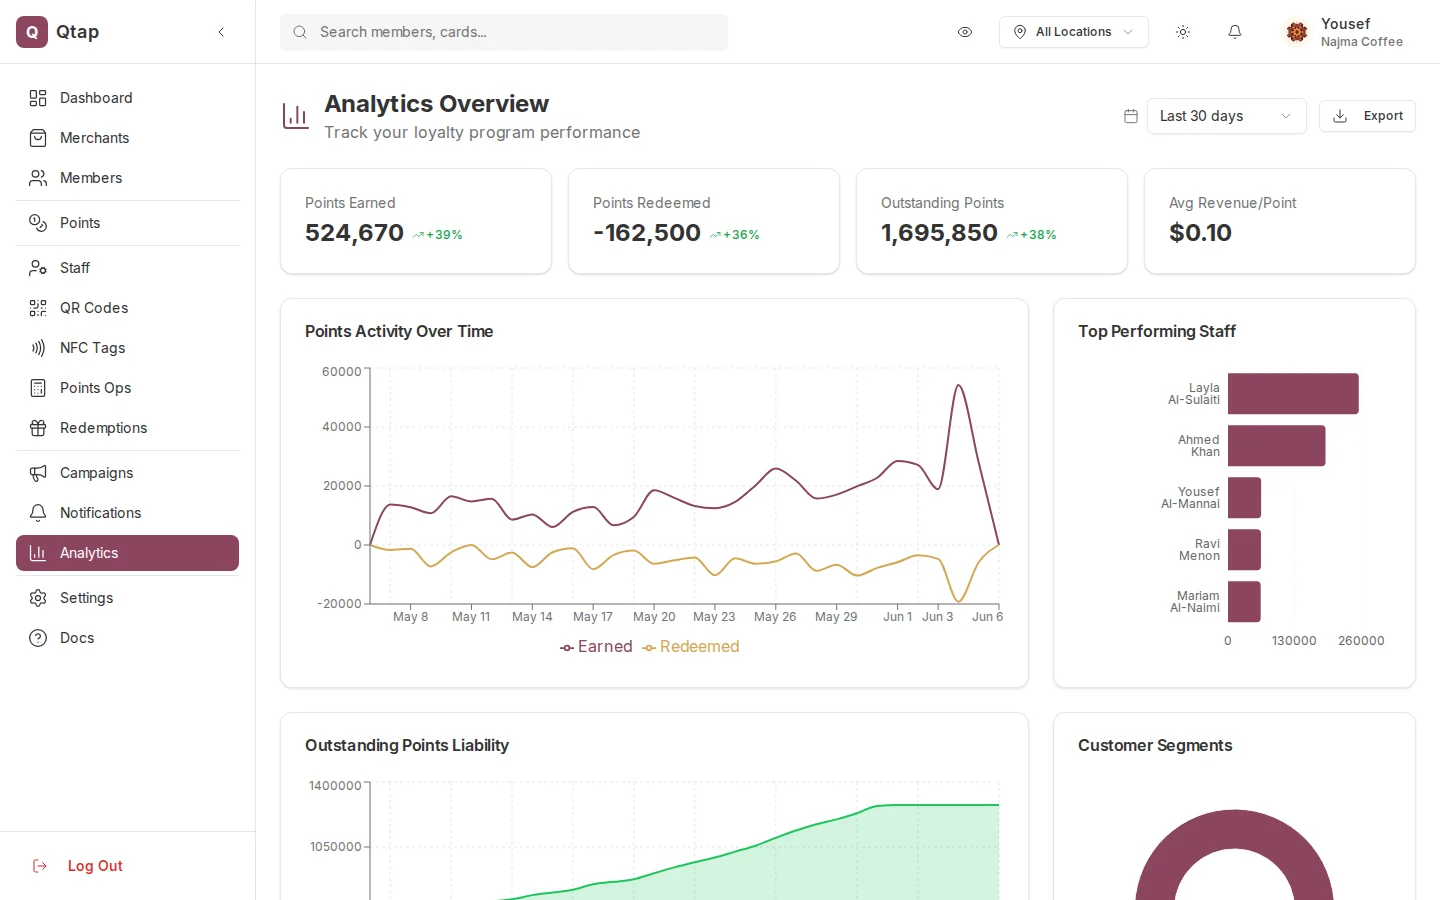
The Analytics section shows how your loyalty program is performing — stamps or points issued, active members, peak hours, staff activity, and customer segments. What you see depends on whether your program uses stamp cards or a points program.
 ## Time Period Selector
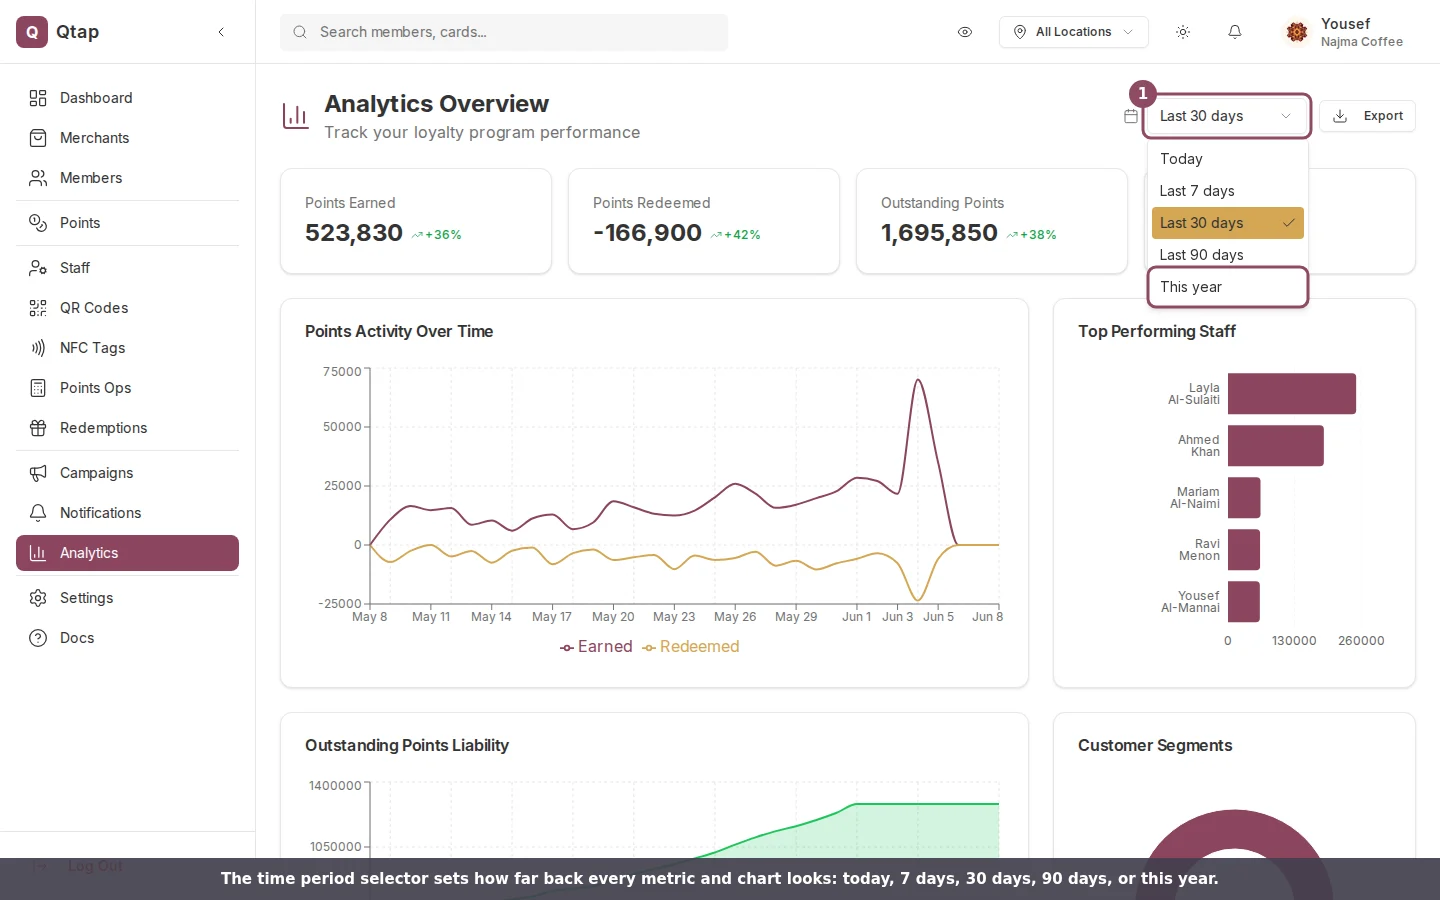
At the top right of the Analytics page, select how far back you want to look. The options are **7 days**, **30 days**, **90 days**, and **12 months**. All charts and metrics on the page update when you change this.
## Time Period Selector
At the top right of the Analytics page, select how far back you want to look. The options are **7 days**, **30 days**, **90 days**, and **12 months**. All charts and metrics on the page update when you change this.
 ## Stamp Card Analytics
If your program uses stamp cards, the analytics page shows:
* **Total stamps issued** and the change compared to the previous period
* **Total redemptions** and redemption rate
* **Active members** — members who scanned at least once in the selected period
* **New members** joined in the period
* A **Stamps over time** line chart showing daily or weekly stamp volume
* A **Staff performance** bar chart showing how many stamps each staff member issued
* A **Customer segments** donut chart breaking members into groups such as "loyal", "at risk", and "new"
* A **Peak hours** heatmap showing which days and times are busiest
## Points Program Analytics
If your program uses points, the analytics page shows:
* **Points issued** and **points redeemed** totals
* **Outstanding balance** — points that have been issued but not yet spent
* A **Points over time** line chart
* A **Points balance trend** showing how the total outstanding balance is changing
* A **Points expiry forecast** — how many points are scheduled to expire in the coming months
* **Top points earners** — the members accumulating the most points
* **Reward popularity** — which rewards members are redeeming most
The AI Insights panel below the main metrics shows automatically generated observations about your data, such as unusual drops in activity or members who are close to earning a reward.
## Exporting Analytics
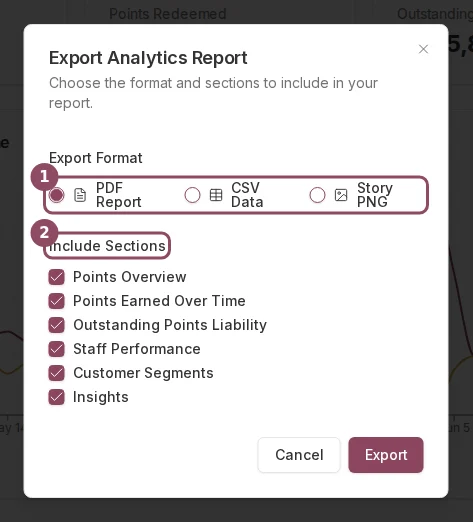
Click **Export** at the top right to download your analytics data. You can export as:
* **CSV** — a spreadsheet with the raw data for the selected period and sections
* **PDF** — a formatted report
* **Instagram Story** — a branded image summarizing your key metrics, sized for sharing
In the export dialog, check or uncheck the sections you want to include before downloading.
## Stamp Card Analytics
If your program uses stamp cards, the analytics page shows:
* **Total stamps issued** and the change compared to the previous period
* **Total redemptions** and redemption rate
* **Active members** — members who scanned at least once in the selected period
* **New members** joined in the period
* A **Stamps over time** line chart showing daily or weekly stamp volume
* A **Staff performance** bar chart showing how many stamps each staff member issued
* A **Customer segments** donut chart breaking members into groups such as "loyal", "at risk", and "new"
* A **Peak hours** heatmap showing which days and times are busiest
## Points Program Analytics
If your program uses points, the analytics page shows:
* **Points issued** and **points redeemed** totals
* **Outstanding balance** — points that have been issued but not yet spent
* A **Points over time** line chart
* A **Points balance trend** showing how the total outstanding balance is changing
* A **Points expiry forecast** — how many points are scheduled to expire in the coming months
* **Top points earners** — the members accumulating the most points
* **Reward popularity** — which rewards members are redeeming most
The AI Insights panel below the main metrics shows automatically generated observations about your data, such as unusual drops in activity or members who are close to earning a reward.
## Exporting Analytics
Click **Export** at the top right to download your analytics data. You can export as:
* **CSV** — a spreadsheet with the raw data for the selected period and sections
* **PDF** — a formatted report
* **Instagram Story** — a branded image summarizing your key metrics, sized for sharing
In the export dialog, check or uncheck the sections you want to include before downloading.
 See how many stamps or points each staff member has issued
Compare activity across your different locations
See how many stamps or points each staff member has issued
Compare activity across your different locations