> ## Documentation Index
> Fetch the complete documentation index at: https://docs.qtap.qa/llms.txt
> Use this file to discover all available pages before exploring further.
# Points Activity Report
> Read every points transaction in your program, filtered by branch and time period.
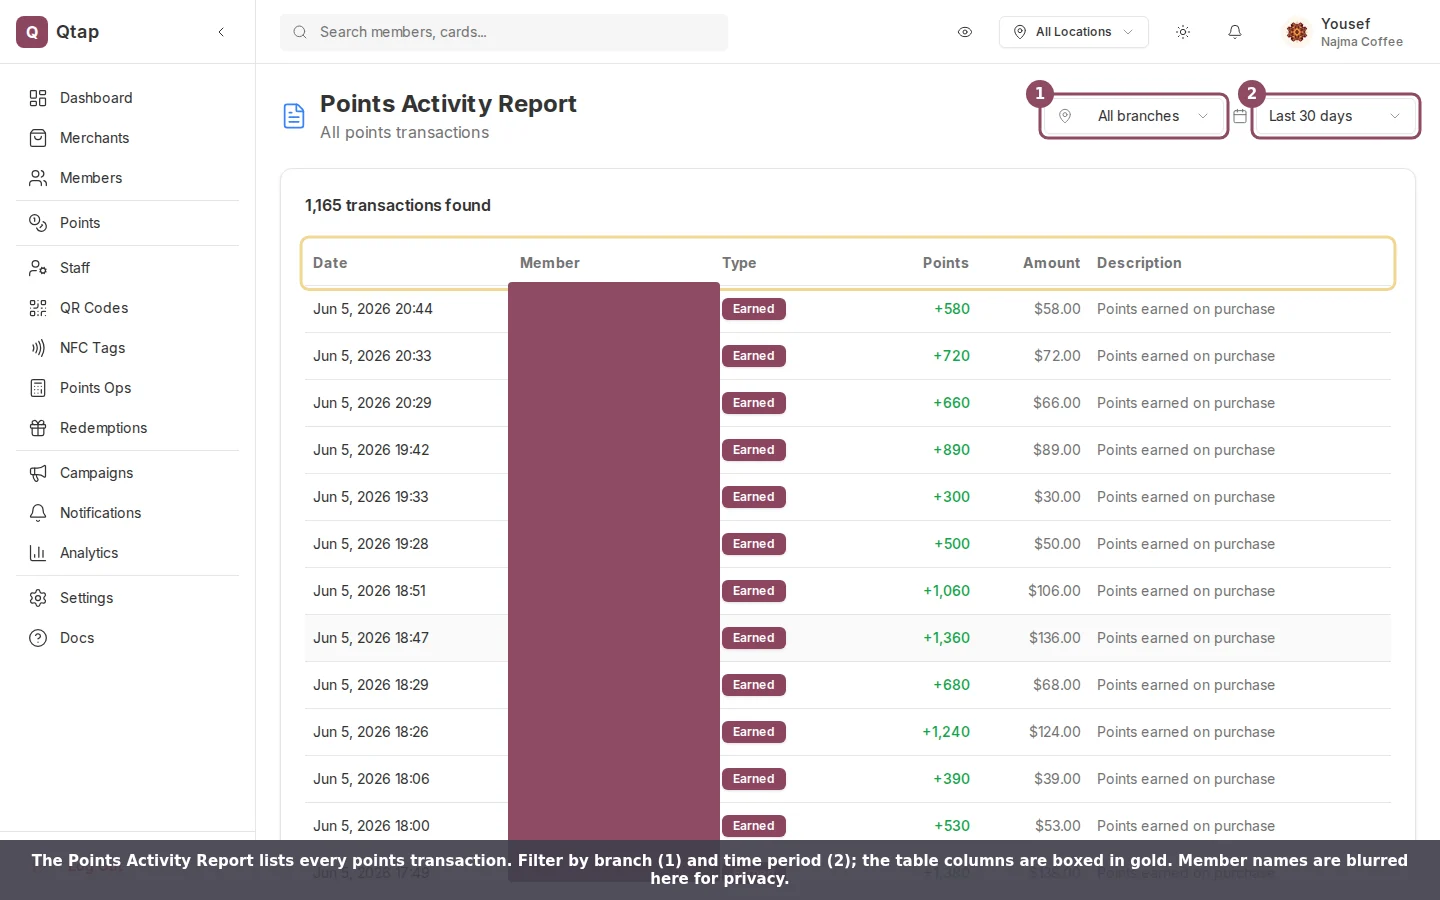
The Points Activity Report is the full ledger of your points program. Every time a member earns, redeems, has points adjusted, or has points expire, a row lands here. It's the place to answer questions like "what happened on the till last Thursday" or "who earned the most this month".
There's no sidebar link for it. Open the [Detailed Reports hub](/merchants/analytics/reports-hub) and choose **Points Activity Report**, or go straight to `dashboard.qtap.qa/analytics/reports/points-activity`. This report is for points programs. If you run stamp cards only, it stays empty.
 ## Filtering the ledger
Two controls sit at the top right.
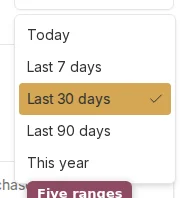
The **time period** selector covers Today, Last 7 days, Last 30 days, Last 90 days, and This year. It opens on Last 30 days.
## Filtering the ledger
Two controls sit at the top right.
The **time period** selector covers Today, Last 7 days, Last 30 days, Last 90 days, and This year. It opens on Last 30 days.
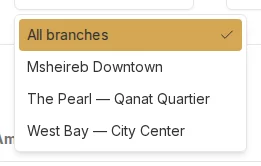
 The **branch** filter narrows the ledger to one location. It only appears when your account has more than one branch, and "All branches" shows everything together.
 Change either filter and the table reloads. The count above the table updates to match, for example "1,165 transactions found".
## Reading a row
Each row has six columns: the date and time, the member's name, the type, the points, the amount, and a description.
The **type** is one of Earned, Redeemed, Adjusted, or Expired. Earned rows show the points in green with a plus sign. Redeemed, Adjusted, and Expired rows show them in red with a minus sign, so a glance down the Points column tells you what was added and what was taken away.
Change either filter and the table reloads. The count above the table updates to match, for example "1,165 transactions found".
## Reading a row
Each row has six columns: the date and time, the member's name, the type, the points, the amount, and a description.
The **type** is one of Earned, Redeemed, Adjusted, or Expired. Earned rows show the points in green with a plus sign. Redeemed, Adjusted, and Expired rows show them in red with a minus sign, so a glance down the Points column tells you what was added and what was taken away.
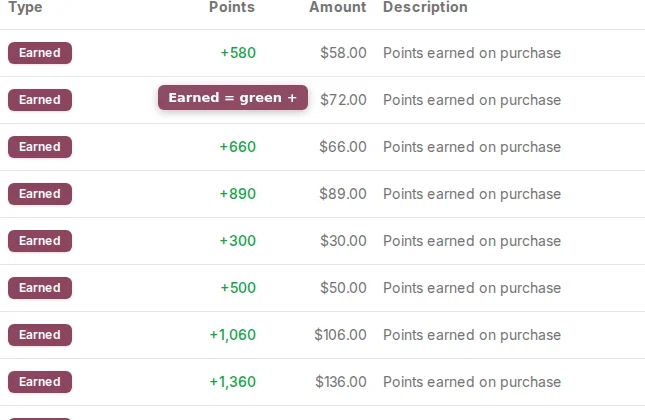 The **amount** is the purchase total linked to a transaction, shown when points were earned on a sale. Rows with no linked sale, such as a manual adjustment or an expiry, show a dash. The **description** is the short note saved with the transaction, like "Points earned on purchase".
Long histories load 50 rows at a time. When there's more than one page, Previous and Next buttons and a page count sit below the table.
## Who can see it
Owners and managers can open this report. Staff can't by default, because analytics access is off for the staff role. To let a staff member in, turn on their analytics access in [Roles and permissions](/merchants/staff/roles-permissions).
For the headline numbers and charts that sit above this ledger, start on the [Analytics Overview](/merchants/analytics/overview).
The **amount** is the purchase total linked to a transaction, shown when points were earned on a sale. Rows with no linked sale, such as a manual adjustment or an expiry, show a dash. The **description** is the short note saved with the transaction, like "Points earned on purchase".
Long histories load 50 rows at a time. When there's more than one page, Previous and Next buttons and a page count sit below the table.
## Who can see it
Owners and managers can open this report. Staff can't by default, because analytics access is off for the staff role. To let a staff member in, turn on their analytics access in [Roles and permissions](/merchants/staff/roles-permissions).
For the headline numbers and charts that sit above this ledger, start on the [Analytics Overview](/merchants/analytics/overview).