> ## Documentation Index
> Fetch the complete documentation index at: https://docs.qtap.qa/llms.txt
> Use this file to discover all available pages before exploring further.
# Staff Performance Report
> See which team members issue the most stamps and points, process the most rewards, and serve the most members.
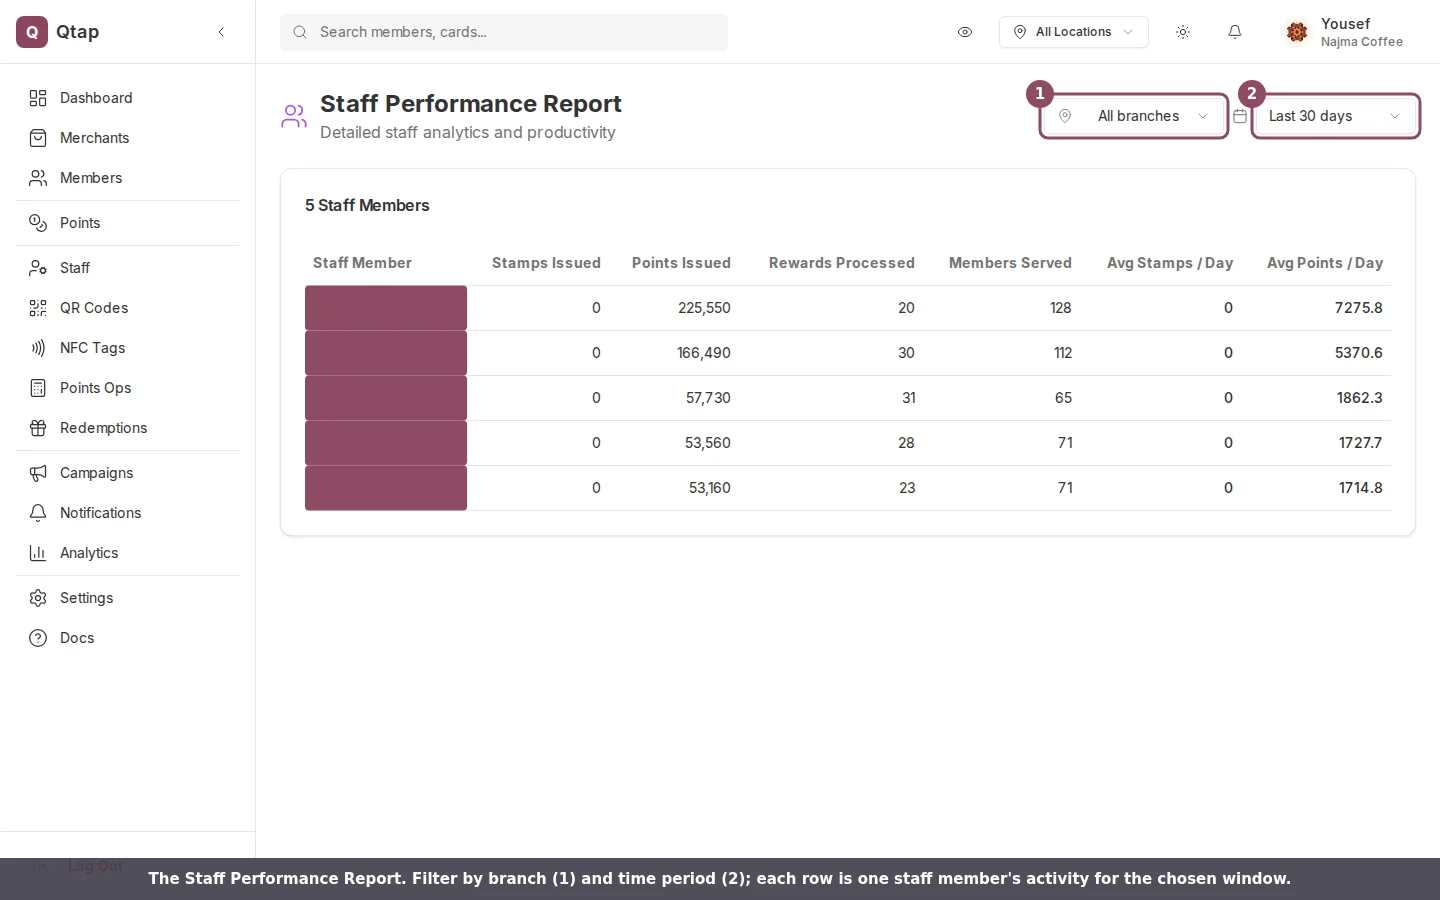
The Staff Performance Report turns your transaction history into a scorecard for each person on your team. It shows who issued stamps and points, who processed rewards at the counter, and how many members each one served over a period you choose. Use it to spot your busiest staff and to see who might need a hand on a quiet shift.
The report lives in the [Detailed Reports hub](/merchants/analytics/reports-hub). There is no sidebar link, so open it directly at `dashboard.qtap.qa/analytics/reports/staff-performance`, or open the hub and click the Staff Performance card.
 ## What each column means
Every figure comes from your transaction ledger, counting only the actions that were recorded against a staff member for the period you selected.
## What each column means
Every figure comes from your transaction ledger, counting only the actions that were recorded against a staff member for the period you selected.
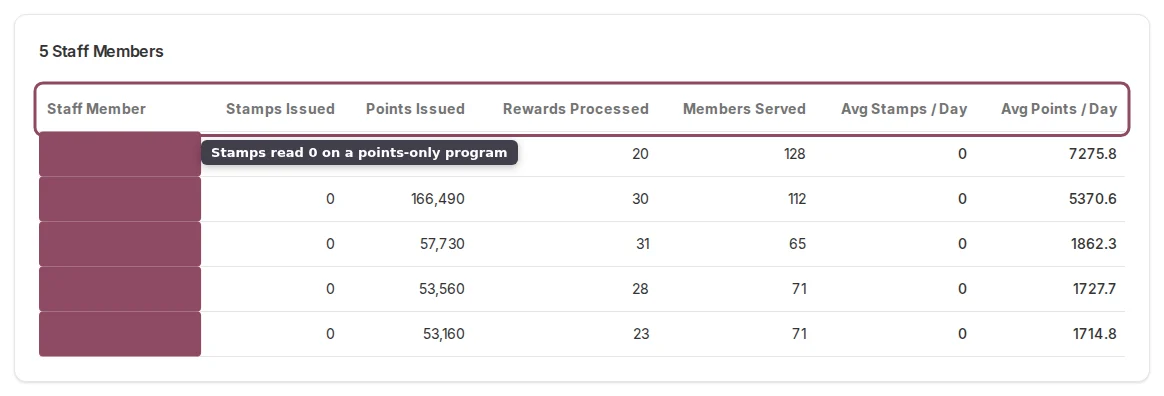 * **Stamps Issued** is the total number of stamps that staff member added.
* **Points Issued** is the total number of points they awarded.
* **Rewards Processed** is how many redemptions they handled.
* **Members Served** is how many different members they interacted with. A member who came in five times still counts once.
* **Avg Stamps / Day** and **Avg Points / Day** divide the totals above by the number of days in the period, so a 7-day window and a 90-day window stay comparable.
Rows are sorted with the most active staff first. On a points-only program the stamp columns read zero, and on a stamp-only program the points columns read zero. That is expected for an account that runs one kind of program.
Only actions tagged with a staff member are counted. A stamp added by a customer scanning their own QR code has no staff behind it, so it won't appear here.
## Filter by branch and period
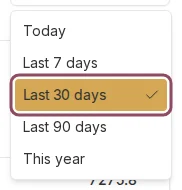
The time period selector covers Today, Last 7 days, Last 30 days, Last 90 days, and This year. It opens on Last 30 days. Change it and the table reloads for the new window.
* **Stamps Issued** is the total number of stamps that staff member added.
* **Points Issued** is the total number of points they awarded.
* **Rewards Processed** is how many redemptions they handled.
* **Members Served** is how many different members they interacted with. A member who came in five times still counts once.
* **Avg Stamps / Day** and **Avg Points / Day** divide the totals above by the number of days in the period, so a 7-day window and a 90-day window stay comparable.
Rows are sorted with the most active staff first. On a points-only program the stamp columns read zero, and on a stamp-only program the points columns read zero. That is expected for an account that runs one kind of program.
Only actions tagged with a staff member are counted. A stamp added by a customer scanning their own QR code has no staff behind it, so it won't appear here.
## Filter by branch and period
The time period selector covers Today, Last 7 days, Last 30 days, Last 90 days, and This year. It opens on Last 30 days. Change it and the table reloads for the new window.
 The branch filter only appears when your business has more than one location, since there is nothing to compare on a single branch. A staff member who is assigned to specific branches sees only those branches in the list.
## Open one staff member
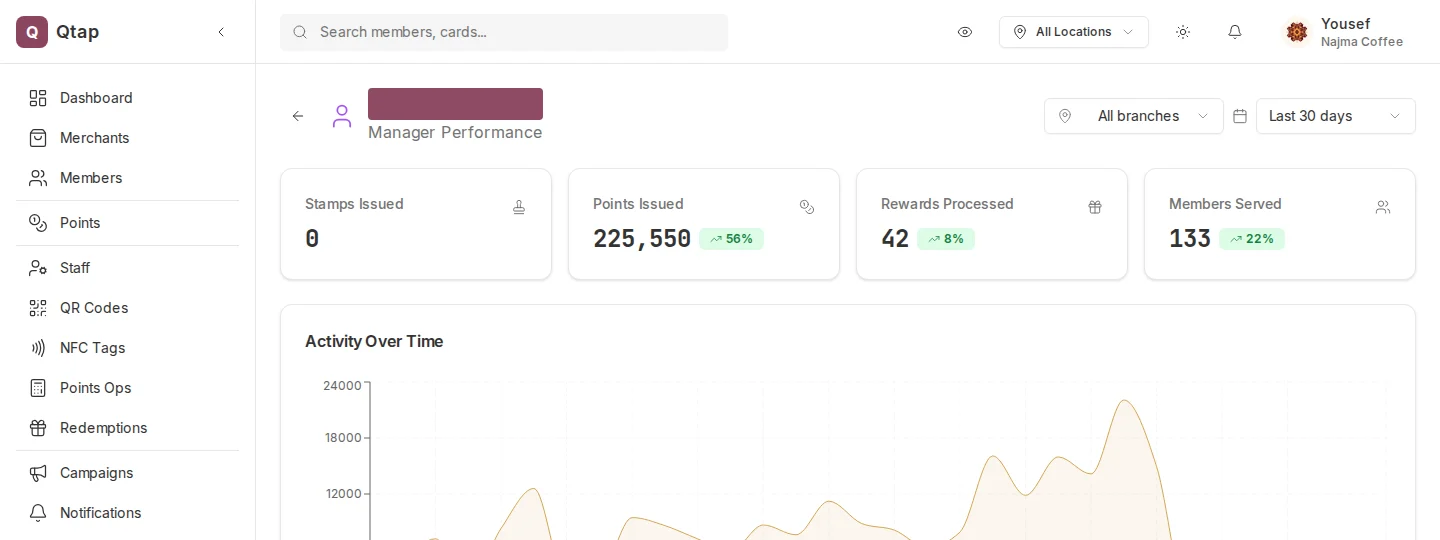
Click any row to open that person's own page. It leads with their headline numbers, each marked with how it changed against the period before, followed by an activity-over-time chart. Multi-branch businesses also get a per-branch breakdown and a recent-activity list.
The branch filter only appears when your business has more than one location, since there is nothing to compare on a single branch. A staff member who is assigned to specific branches sees only those branches in the list.
## Open one staff member
Click any row to open that person's own page. It leads with their headline numbers, each marked with how it changed against the period before, followed by an activity-over-time chart. Multi-branch businesses also get a per-branch breakdown and a recent-activity list.
 ## Who can see it
Owners and managers can open the report. Staff can't by default, because analytics access is off for the staff role. To let a team member in, turn on their analytics permission (see [Roles and permissions](/merchants/staff/roles-permissions)).
The hub that opens this report and three others.
A line-by-line log of what each staff member did and when.
## Who can see it
Owners and managers can open the report. Staff can't by default, because analytics access is off for the staff role. To let a team member in, turn on their analytics permission (see [Roles and permissions](/merchants/staff/roles-permissions)).
The hub that opens this report and three others.
A line-by-line log of what each staff member did and when.