dashboard.qtap.qa/analytics/reports/revenue-impact. There is no sidebar link.
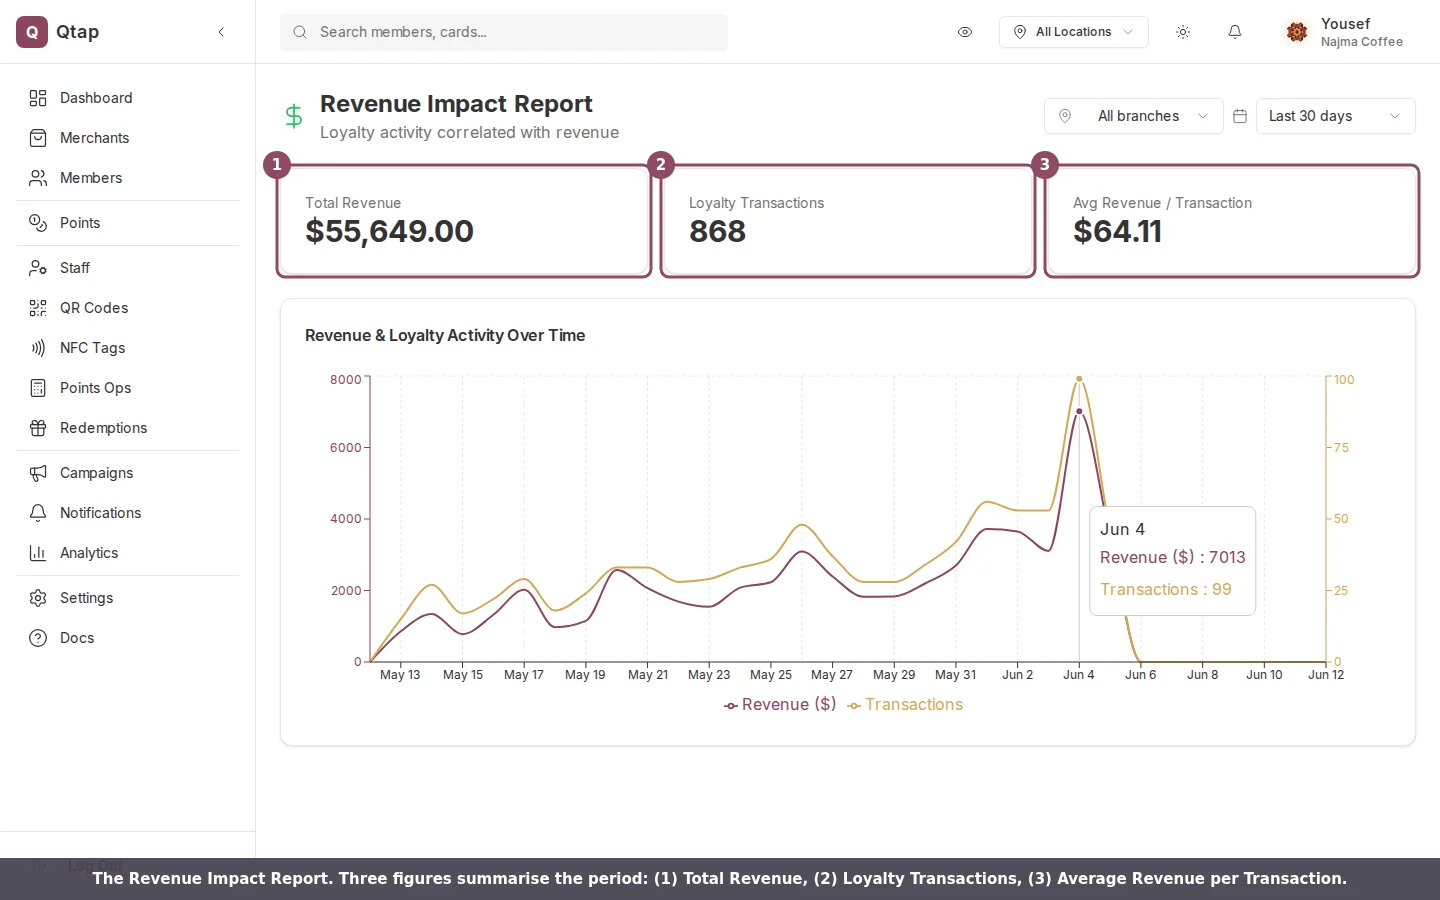
The Revenue Impact Report: three summary figures and a chart of revenue against loyalty activity over time.
The three figures
Across the top sit three numbers for the period you have selected:- Total Revenue adds up the purchase amounts recorded each time a member earned points in the period.
- Loyalty Transactions counts how many of those point-earning visits happened.
- Avg Revenue / Transaction divides the first by the second, so you see the typical spend behind one visit.
The chart
Below the figures, one chart plots two lines on the same dates: revenue on the left axis and the number of loyalty transactions on the right. When the two lines rise and fall together, your loyalty activity is tracking your takings. Hover any day to read the exact revenue and visit count for that date.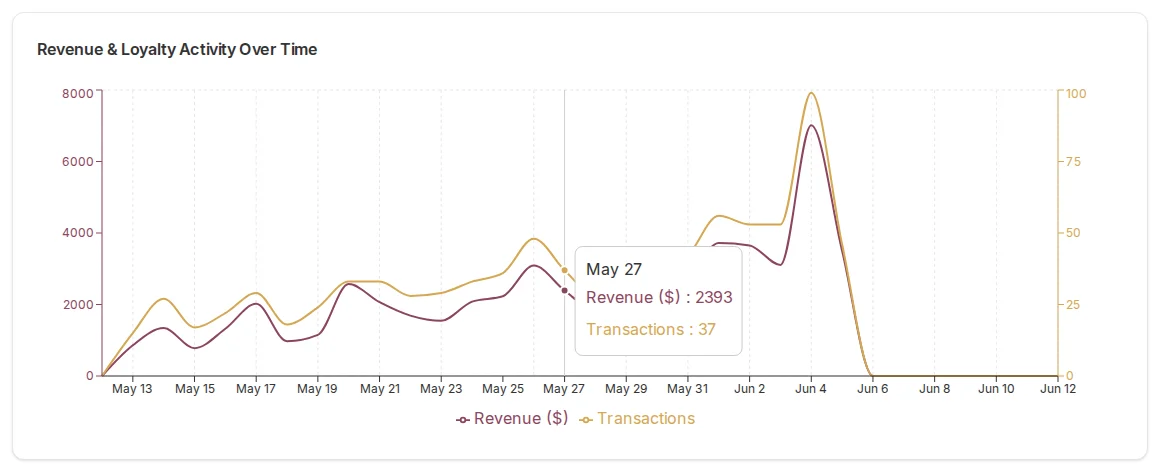
Revenue and loyalty transactions plotted together. Hover a day to read both values.
Choosing the period and branch
Two controls at the top right shape what you see. The branch filter narrows the report to one location, and the time period switches between Today, the last 7, 30, or 90 days, and this year. Change either and the report reloads with the new range.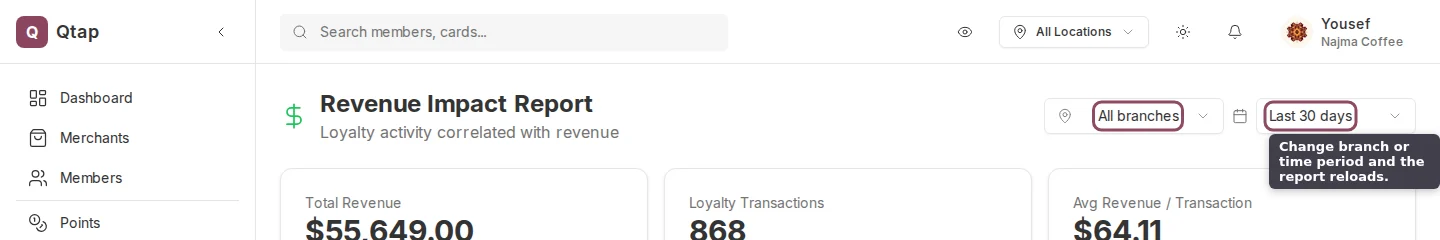
Use the branch filter and the time period selector to focus the report.
The revenue figure is an estimate
The revenue here is an estimate Qtap builds from the purchase amounts your staff enter when they award points. It is not a feed from your point-of-sale system. Use it to watch the shape of the trend and keep your till for the exact books. A few things follow from how the number is built:- A stamp-only program records no purchase amounts, so its Revenue Impact Report stays empty. This report is for points programs.
- If a member earns points without a purchase amount entered, that visit adds a transaction but no revenue, which can pull the average down.
For the headline numbers and charts that sit above these reports, start on the Analytics Overview. For the full set of detailed reports, see the Reports hub.